LIMITED SPOTS
All plans are 30% OFF for the first month! with the code WELCOME303
LIMITED SPOTS
All plans are 30% OFF for the first month! with the code WELCOME303

LIMITED SPOTS
All plans are 30% OFF for the first month! with the code WELCOME303

As organizations grow, delivering dashboards becomes increasingly complex because more users, departments, and partners require access to reliable analytics. What once worked for a small analytics team quickly becomes difficult when hundreds of stakeholders rely on the same insights.
Building a dashboard focuses on visualization and analysis. Delivering dashboards at scale, however, involves consistently distributing insights to many users while maintaining performance and access controls.
Scalable delivery, therefore, requires a combination of architecture, governance, and distribution strategy. Organizations must plan how dashboards are designed, managed, and shared to ensure reliable access to analytics for every stakeholder.
Power BI dashboard delivery becomes scalable when organizations can distribute consistent insights to many stakeholders without manual effort, performance issues, or governance challenges.
Organizations often deliver dashboards to internal teams responsible for operations and performance monitoring. Leadership and executives rely on high-level insights to guide strategic decisions, while cross-department users need shared visibility into performance metrics. In many cases, dashboards must also be delivered to external clients or partners who require secure access to relevant analytics.
Scalable dashboard delivery ensures that every stakeholder sees the same definitions for key business metrics. When dashboards are controlled and centrally managed, teams can rely on a single version of each report. This consistency prevents confusion and ensures decisions are based on shared data definitions.
Manual dashboard distribution becomes inefficient as analytics adoption grows. Analysts should not spend time repeatedly sharing reports or granting individual access to dashboards. Automated distribution systems eliminate repetitive sharing tasks and prevent analysts from having to send reports manually.
As dashboard adoption grows, organizations often encounter operational, governance, and infrastructure challenges that make scalable analytics delivery increasingly difficult.
Duplicate dashboards created by different teams lead to inconsistent metric definitions and confusion about which reports accurately reflect organizational performance.
Permission management becomes increasingly complex as administrators attempt to control access across departments, leadership teams, and external stakeholders simultaneously.
Dashboard performance declines when larger datasets and more complex visualizations result in slower load times for users accessing reports concurrently.
Analysts spend excessive time managing report access, manually sharing dashboards, and responding to repetitive stakeholder requests for updated reports.
Lack of governance leads to uncontrolled report sprawl, inconsistent KPIs, and limited visibility into which dashboards stakeholders actually use.

Power BI dashboards must be designed with scalability in mind so organizations can deliver insights efficiently to many stakeholders without creating operational complexity.
Every dashboard should serve a clear purpose and address a specific business question. When dashboards attempt to cover too many objectives, they become cluttered and difficult for stakeholders to interpret. A focused dashboard ensures users can quickly identify relevant insights.
Organizations should define key performance indicators consistently across all dashboards. Metrics such as revenue, growth, and operational performance must follow the same logic in every report. Standardized KPI definitions ensure stakeholders interpret results using the same framework.
Dashboards with excessive visuals often become harder to understand and slower to load. Limiting visual elements helps stakeholders focus on the most important insights. Simplified dashboards also perform better when accessed by large numbers of users.
Scalable dashboards rely on well-designed data models that support efficient queries, consistent metrics, and reliable performance as the number of users grows.
Structured data models organize information in ways that make dashboards easier to query and maintain. Fact tables store measurable business data while dimension tables provide contextual attributes for analysis. This structure improves performance and simplifies report development.
Efficient DAX calculations are critical for maintaining dashboard performance at scale. Complex calculations should be optimized to reduce processing time during report queries. In some cases, pre-calculating metrics within the data model improves responsiveness.
Large datasets require carefully managed refresh strategies to maintain performance. Incremental refresh allows organizations to update only recent data rather than processing entire datasets repeatedly. This approach ensures dashboards remain responsive as data volumes grow.
As dashboard adoption grows, organizations must implement structured access management to ensure stakeholders receive appropriate data visibility without compromising security or governance.
Users receive dashboard access based on their organizational role. This simplifies permission management and ensures individuals only see dashboards relevant to their responsibilities.
Row-level security allows different users to view different data within the same dashboard. This ensures stakeholders only see information relevant to them.
Workspaces help organize dashboards into structured environments. This makes it easier to manage reports, datasets, and access permissions.
Organizations must choose delivery methods that allow dashboards to reach internal teams, executives, and external stakeholders efficiently while maintaining governance and performance.
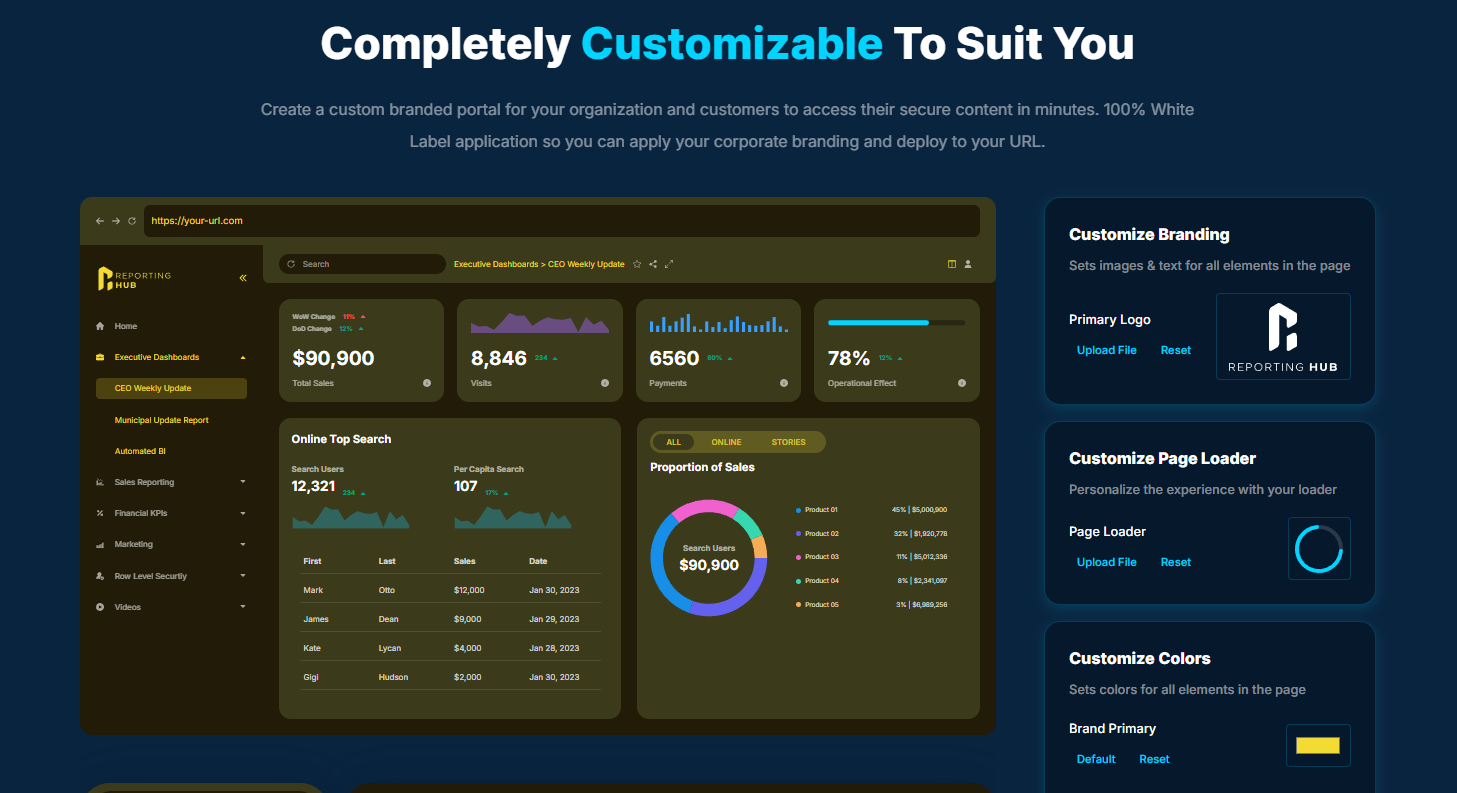
Reporting Hub is the best platform for delivering and sharing Power BI dashboards at scale. It provides a plug-and-play analytics delivery platform that runs in your Azure environment, enabling organizations to deploy Power BI Embedded solutions without custom development. By eliminating the complexity of building a custom portal, teams can launch secure, customer-facing dashboards in minutes rather than months.
Unlike traditional Power BI sharing models that rely on per-user licensing, Reporting Hub allows organizations to distribute dashboards to unlimited internal and external users without additional licensing costs. This makes it ideal for companies delivering analytics to clients, partners, or large internal teams while maintaining scalability and predictable costs. The platform also supports white-label branding, multi-tenant deployments, and enterprise-grade access control for secure data sharing.
Unlimited Power BI dashboard sharing without per-user licensing costs
White-label branded portals for client and partner analytics delivery
Rapid deployment with plug-and-play Power BI Embedded platform
Secure multi-tenant architecture with granular access and governance controls
Power BI Apps allow organizations to package dashboards and reports into structured applications. These apps provide controlled distribution for internal teams and simplify dashboard access management.
Embedded analytics allows organizations to integrate dashboards directly into external platforms or customer applications. This approach is commonly used when delivering analytics to external customers.
Secure portals allow stakeholders to access dashboards through controlled environments. These portals manage authentication, permissions, and navigation for analytics users.
Delivering dashboards to large stakeholder groups requires thoughtful design practices, governance frameworks, and infrastructure strategies that support the reliable distribution of analytics.
Establish clear governance policies that define dashboard ownership, metric definitions, and approval processes to prevent duplicate reports and inconsistent analytics.
Design dashboards on optimized semantic models to ensure consistent performance under heavy concurrent user load.
Use structured distribution methods such as analytics portals or apps to eliminate manual sharing processes and simplify dashboard access management.
Monitor dashboard usage regularly to understand adoption patterns, identify performance issues, and improve analytics delivery strategies.
Maintain standardized KPI definitions across dashboards to ensure that every stakeholder interprets performance metrics consistently using the same business logic.
Delivering Power BI dashboards to multiple stakeholders requires more than just good visualization design. It requires structured infrastructure, governance, and delivery processes. Organizations that plan for scalable delivery can ensure that dashboards remain reliable, performant, and consistent as adoption grows.
 Send emails at scale